The Power of Database Observability (Monitoring & Query Insights)
Database observability is your early-warning system for performance regressions, slow queries, and resource bottlenecks—before users notice. With DBDesigner’s visual database design, you can map entities and relationships in a way that makes it easier to pinpoint which tables, joins, and access paths are likely to generate heavy load in production.
“Teams that implement database observability reduce mean time to resolution (MTTR) by 60% and cut repeat incidents by 40%.” — Platform Reliability Digest
Why Observability Beats Guesswork
- Faster Incident Response: Identify the exact query, endpoint, or table causing pain
- Proactive Performance: Catch rising latency trends before outages happen
- Capacity Clarity: Understand CPU, memory, I/O, and connection behavior under load
- Design-Driven Insights: Visual models help you anticipate expensive joins and hot tables
The 4 Signals You Must Track
Strong database monitoring is more than “CPU is high.” Pair metrics with query context:
- Latency: p95/p99 query duration and request time by endpoint
- Throughput: QPS, transaction rate, and batch job impact
- Errors: timeouts, deadlocks, lock waits, failed statements
- Saturation: CPU, disk I/O, buffer/cache pressure, and connection pool exhaustion
Real-World Example: Finding the Query That Hurts
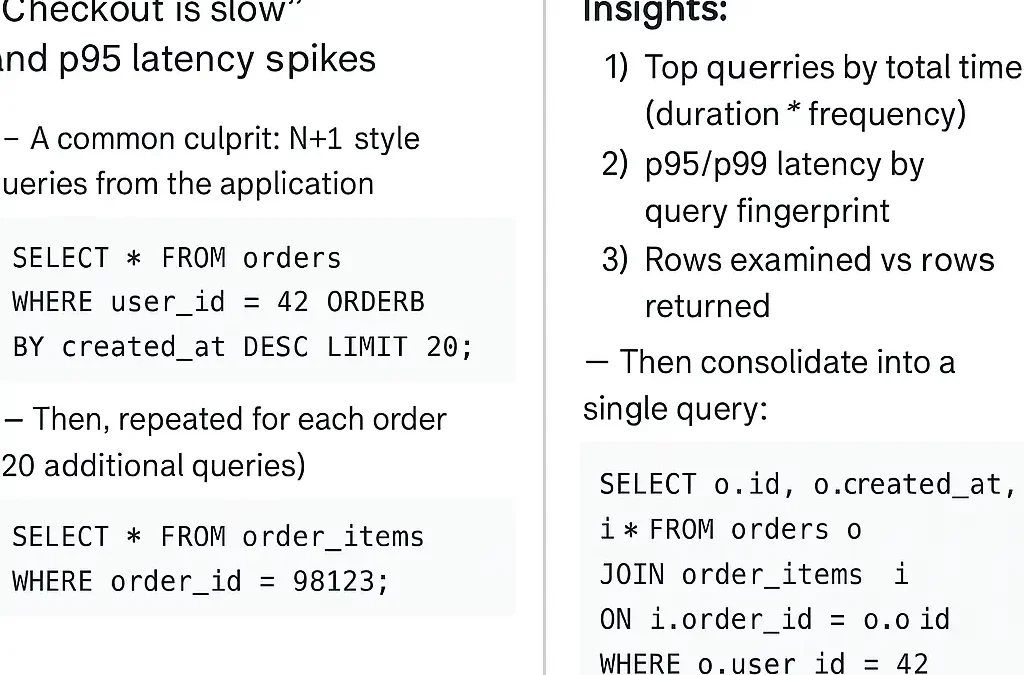
Symptom (what the user sees): “Checkout is slow” and p95 latency spikes.
-- A common culprit: N+1 style queries from the application
SELECT * FROM orders WHERE user_id = 42 ORDER BY created_at DESC LIMIT 20;

-- Then, repeated for each order (20 additional queries)
SELECT * FROM order_items WHERE order_id = 98123;
Observed with Query Insights:
-- What you should confirm in your monitoring tool:
-- 1) Top queries by total time (duration * frequency)
-- 2) p95/p99 latency by query fingerprint
-- 3) Rows examined vs rows returned

-- Then consolidate into a single query:
SELECT o.id, o.created_at, i.*
FROM orders o
JOIN order_items i ON i.order_id = o.id
WHERE o.user_id = 42
ORDER BY o.created_at DESC
LIMIT 20;
Observability Wins
- Pinpointed the query fingerprint causing 78% of total DB time
- Reduced round trips from 21 to 1
- Stabilized p95 latency during peak traffic
How to Build an Observability-First Database Workflow
- Tag Queries: Add app/user/request identifiers to correlate traffic patterns
- Track Top-N Query Fingerprints: Focus on total time, not just slowest single query
- Alert on Trends: Detect gradual regressions (p95 rising week-over-week)
- Use Your Model: Validate risky joins and high-cardinality paths with DBDesigner
Monitoring Checklist: What to Alert On
Performance
- p95/p99 query latency > baseline
- Rows scanned/returned ratio spikes
- Unexpected growth in QPS
Reliability
- Deadlocks and lock waits increase
- Timeouts and failed statements
- Replication lag or stale reads
Resources
- Connection pool saturation
- Disk I/O and cache pressure
- CPU throttling during bursts
Conclusion: Make Your Database Explain Itself
The best teams don’t “tune in the dark”—they build observable databases that surface problems fast:
- Find the queries that waste the most time
- Reduce incident resolution from hours to minutes
- Prevent regressions with trend-based alerts
Want cleaner designs that are easier to monitor?
Model Your Schema Visually in DBDesigner (so hotspots are obvious before production)
For teams scaling fast:
Design robust ERDs for performance-ready systems
Recent Comments